
All Energy Infrastructure and Resources Interactive Map

This resource has been reviewed by SubjectToClimate's climate scientists and verified for scientific accuracy and up-to-date information. Learn about our review process →
Provided by: EIA|Published on: April 27, 2021
Data, Graphs, and MapsScientist Reviewed
89101112AP
Scientist Reviewed This resource has been reviewed by SubjectToClimate's climate scientists and verified for scientific accuracy and up-to-date information. Learn about our review process →
Synopsis
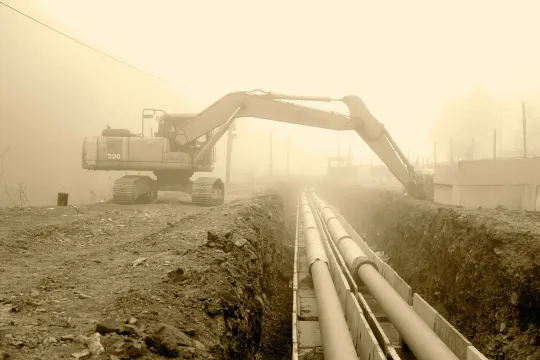
- This interactive map of the United States features all energy infrastructure and resources.
- Items featured on the map include power plants, pipelines, storage facilities, fossil fuel reserves, uranium resources, wind farms, and solar farms.
Subjects: Science, Geography
Authors: EIA
Region: North America, USA - Northeast, United States, New Jersey
Languages: English
Teaching Materials
Positives
- There is a wealth of data to explore.
Prerequisites
- This map can be overwhelming if all the layers are viewed at once.
- You can turn layers on and off using the buttons in the top right corner of the interactive map.
- The map includes the 50 United States and Puerto Rico.
- There are 12 main categories to view on this map: all coal mines, all power plants, oil and gas refining and processing, uranium production, market/trading hubs, pipelines and transmission, other transport and storage, oil and gas wells and platforms, fossil resources, renewable resources, uranium resources, and administrative areas.
Differentiation & Implementation
- Geography students could use this map to study the distribution and density of fossil fuel reserves. Students could also study the location of wind and solar farms to better understand the best conditions for generating electricity through wind and solar.
- Students could use this in a social studies or civics class to study state policy and federal policy.
- This interactive data resource that allows you to explore global energy data might work well with this resource in a lesson.
This resource is an interactive map that includes the entirety of the United States energy infrastructure system. This includes power plants, mines, transmission lines, pipelines, and processing centers, among others. Viewing all of the layers at once is somewhat overwhelming, but looking at individual layers and comparing them to one another is enlightening (i.e., there are clear differences among state policies). This resource is recommended for teaching.
Teaching Tips
Standards
Resource Type and Format
Scientist Reviewed
This resource has been reviewed by SubjectToClimate's climate scientists and verified for scientific accuracy and up-to-date information. Our review process ensures that every resource in our library reflects the current state of climate science.
Learn about our review process →