
Fluid Earth Viewer

This resource has been reviewed by SubjectToClimate's climate scientists and verified for scientific accuracy and up-to-date information. Learn about our review process →
Provided by: The Ohio State University|Published on: November 10, 2023
VideosScientist Reviewed
6-AP
Scientist Reviewed This resource has been reviewed by SubjectToClimate's climate scientists and verified for scientific accuracy and up-to-date information. Learn about our review process →
Synopsis
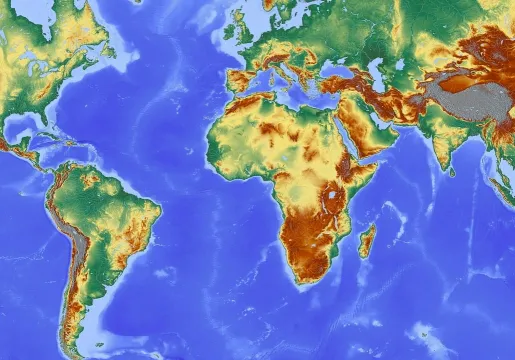
- This interactive map displays real-time surface temperatures and other data worldwide.
- Students will learn about up-to-date information, such as weather, the ocean, and the climate, through a helpful sidebar with tabs for variables and several projection choices.
- Students can also travel in a virtual "time machine" to view data from other years.
Subjects: Earth and Space Sciences, Geography
Authors: The Ohio State University
Region: Global
Languages: English
Teaching Materials
Positives
- There are many views to select from, which provide various projections such as globe, wall map, Arctic, Antarctic, and more.
- Students can click on datasets, such as weather, ocean, and climate, and then choose variables within those datasets.
Additional Prerequisites
- "Time machine" links before 2021 only work for the climate dataset and don't include future projections.
- The website can be shared via social media.
- Teachers and students will need internet access.
Differentiation
- Math teachers can utilize the resource for lessons about latitude and longitude.
- Social studies classes can "pin" various international cities and also "pin" their home cities during a lesson about cultures.
- English teachers can have students manipulate the interactive map and write an informational paragraph about their discoveries.
- Some students may need guidance or a cheat sheet to help them navigate the resource.
- Have students select the climate dataset and use the "Time Machine" function to see how surface temperatures have shifted over time.
This resource, compiled by CLEAN and developed by the Climate Research Center at Ohio State University, is an interactive earth model where students can view the daily temperature, wind, humidity, precipitation, and other variables in real-time. In addition to real-time data, a "time machine" option is available for students to compare data from previous days/weeks/years. This interactive "fluid earth" is a wealth of climate and weather data that can be viewed or downloaded as datasets to be analyzed and graphed.
Teaching Tips
Standards
Resource Type and Format
Scientist Reviewed
This resource has been reviewed by SubjectToClimate's climate scientists and verified for scientific accuracy and up-to-date information. Our review process ensures that every resource in our library reflects the current state of climate science.
Learn about our review process →