
Mapping Inequality

This resource has been reviewed by SubjectToClimate's climate scientists and verified for scientific accuracy and up-to-date information. Learn about our review process →
Provided by: University of Richmond|Published on: August 5, 2022
Data, Graphs, and MapsScientist Reviewed
9101112
Scientist Reviewed This resource has been reviewed by SubjectToClimate's climate scientists and verified for scientific accuracy and up-to-date information. Learn about our review process →
Synopsis
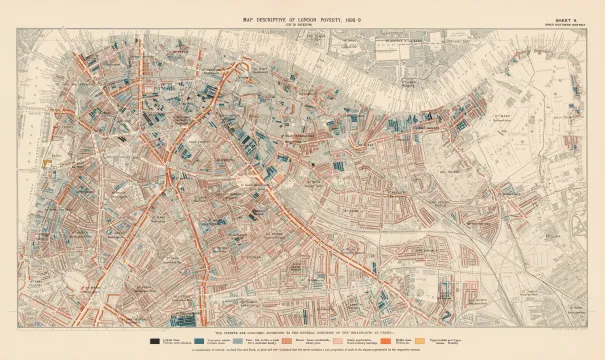
- This interactive map shows historical data, maps, and remarks around redlining practices in 1940s America.
- Students are able to see historic maps for many American cities and counties, the "grades" each section received, and the historical remarks recorded to support those grades.
Subjects: History, Geography
Authors: University of Richmond
Region: North America, USA - Northeast, USA - West, USA - South, USA - Midwest, United States, New Jersey, Virginia
Languages: English
Teaching Materials
Positives
- Primary sources and geographical data are woven together to create an engaging and interactive resource.
- Students can see the redlining that was happening in their area or in areas that they are interested in.
Additional Prerequisites
- Slower internet connections may cause a lag in map data loading.
- Students should have some background knowledge on redlining. The "Introduction" tab on the top left corner gives a good overview.
Differentiation
- Cross-curricular connections can be made in science classes considering how redlining practices impacted current environmental inequalities, and in language arts classes using historical documents in nonfiction reading.
- After teaching redlining in general, have students choose a city or area and read the maps and primary documents. Then, have students write or share their findings and how they think this historical inequality impacts people today.
The map depicts the spatial pattern of redlining in US cities and income inequality distribution. Communities with the highest grade tend to be more vulnerable to climate risk. The map has been properly geocoded for use, shapefiles and data layers are accurately digitized and this is recommended for classroom use.
Teaching Tips
Standards
Resource Type and Format
Scientist Reviewed
This resource has been reviewed by SubjectToClimate's climate scientists and verified for scientific accuracy and up-to-date information. Our review process ensures that every resource in our library reflects the current state of climate science.
Learn about our review process →