
National Energy and Petrochemical Map

This resource has been reviewed by SubjectToClimate's climate scientists and verified for scientific accuracy and up-to-date information. Learn about our review process →
Provided by: Fractracker Alliance|Published on: October 6, 2022
Data, Graphs, and MapsScientist Reviewed
9101112AP
Scientist Reviewed This resource has been reviewed by SubjectToClimate's climate scientists and verified for scientific accuracy and up-to-date information. Learn about our review process →
Synopsis
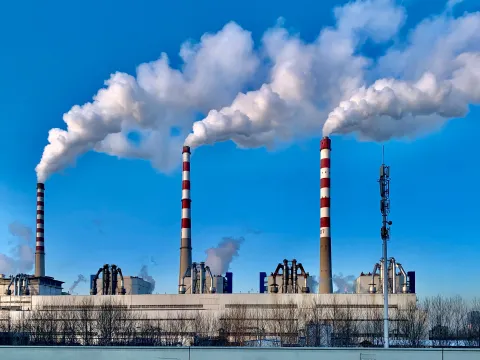
- This interactive map provides an engaging way to visualize the locations and prominence of renewable and non-renewable energy infrastructure in the United States.
- It shows the locations and details of power plants, processing plants, refineries, ports, chemical plants, storage sites, and pipelines.
Subjects: Earth and Space Sciences, Geography
Authors: Fractracker Alliance
Region: North America, United States
Languages: English
Teaching Materials
Positives
- Students can personalize their map by selecting the type of map and what information to display and then share an online link to their map.
- This is a great way to visualize the prominence of clean energy production in the United States.
Additional Prerequisites
- Certain layers of the map will not be visible until zoomed in.
- Students can zoom in and out of the map and select specific locations as well as their own.
- Students should have a general understanding of different sources of energy and whether they are renewable or non-renewable.
Differentiation
- Students can be tasked with trying to determine why there are more of certain energy sources in specific locations like near coastlines or in hotter areas.
- This resource can be used in social studies classes during lessons about policy building for a clean energy transition and in science and geography classes during lessons about the impact of certain energy sources on the local environment and where they are located.
- In a geography class, have students use the "Measure" tool to measure the distance between two places or find the latitude and longitude of a location.
This map shows the split between renewable and nonrenewable energy sources in the United States. The majority of U.S. cities engaged in significant natural gas fracking in 2021, which had disastrous environmental effects. The data layers and attribute table contains precise datasets. The use of this resource in the classroom is advised.
Teaching Tips
Standards
Resource Type and Format
Scientist Reviewed
This resource has been reviewed by SubjectToClimate's climate scientists and verified for scientific accuracy and up-to-date information. Our review process ensures that every resource in our library reflects the current state of climate science.
Learn about our review process →