
Our Ocean | Timelapse in Google Earth

This resource has been reviewed by SubjectToClimate's climate scientists and verified for scientific accuracy and up-to-date information. Learn about our review process →
Provided by: Google Earth|Published on: April 27, 2021
VideosScientist Reviewed
6789101112
Scientist Reviewed This resource has been reviewed by SubjectToClimate's climate scientists and verified for scientific accuracy and up-to-date information. Learn about our review process →
Synopsis
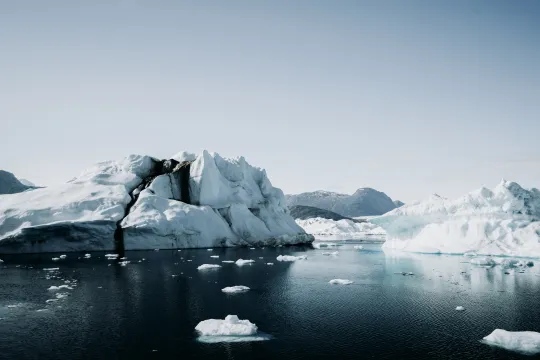
- This time-lapse video uses Google Earth to show how climate change has impacted ice in the Arctic and how it may increase sea level rise in New York City, London, and Tokyo.
- The first part of the video shows how ice in the Arctic has melted between 1984 and 2020, while the second part of the video predicts what sea level rise will do if global temperatures rise by 2°C.
Subjects: Earth and Space Sciences
Authors: Google Earth
Region: Asia, Europe, North America, Polar Regions, New York, New York City
Languages: English
Teaching Materials
Prerequisites:
- Ensure students are familiar with basic climate change concepts such as global warming, greenhouse gas emissions, and sea level rise.
Interdisciplinary Connections:
- Social Studies:
- Students discuss how sea level rise will change societies, considering the cultural, economic, and environmental impacts in major coastal cities and small towns around the world.
- Biology:
- Students make a list of the ways melting sea ice can affect ecosystems in the Arctic. Once students have completed their lists, consider using this video on how species are adapting to warming temperatures in the Arctic. In pairs, students discuss how their list compares to the information in the video.
Related Resources:
- Other resources on this topic include this lesson plan and video on the impact of melting ice in Alaska's coastal communities, this interactive graph that shows ice cover in the Arctic and Antarctic regions, and this lesson plan and experiments on climate change and sea level rise.
This time-lapse video shows the impact of climate change on the Arctic, glaciers, and the ocean. This has further contributed to sea level rise and flooding in low-lying cities. The datasets were sourced from NOAA, IPCC, and UCCRN. Projected sea level rise will put over 800 million people at risk by 2050. This is fact-based and requires robust climate action to limit global warming. This resource is recommended for teaching.
Teaching Tips
Standards
Resource Type and Format
Scientist Reviewed
This resource has been reviewed by SubjectToClimate's climate scientists and verified for scientific accuracy and up-to-date information. Our review process ensures that every resource in our library reflects the current state of climate science.
Learn about our review process →