
PM 2.5 Pollution Plumes Map
Provided by: Climate TRACE|Published on: October 16, 2025|Last updated: July 16, 2026
Grades: 6, 7, 8, 9, 10, 11, 12
Type: Articles/Websites
Subjects: Geography, Health
Authors: Climate TRACE
Location: Earth
This resource has been reviewed by SubjectToClimate's climate scientists and verified for scientific accuracy and up-to-date information. Learn about our review process →
This resource has been reviewed by SubjectToClimate's climate scientists and verified for scientific accuracy and up-to-date information. Learn about our review process →
Synopsis
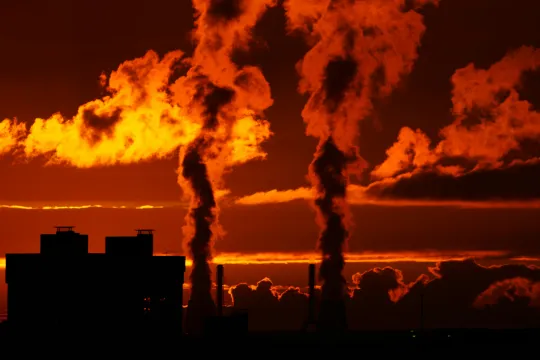
- This interactive map from Climate TRACE shows an interactive map of fine particulate matter (PM 2.5) pollution emitted from urban polluters around the globe, including where the pollution is carried by the prevailing winds.
- Students will be able to explore which areas around the world are most impacted by this form of air pollution.
Teaching Materials
Positives
- The map is self-explanatory and easy to use, allowing for independent student exploration.
- Some unfamiliar terms are conveniently defined for students within the text.
Prerequisites
- Teachers may want to review the terms plumes, super emitter, and others.
Differentiation & Implementation
- Teachers can use this data along with other maps and resources to have students research and create a comprehensive environmental hazards and climate impacts report for a region of choice.
- Teachers can combine the map with this resource, which explains the health impacts of particle pollution.
- To make connections to the Sustainable Development Goals, teachers can review the goals with students and ask students to identify which goals would be addressed if these sites emitting PM 2.5 are shut down.
- To make connections to environmental justice, teachers can combine this map with demographic maps to determine if certain populations are disproportionately impacted by air pollution.
This resource presents visualizations of fine particulate matter plumes in over 2,500 urban areas worldwide. With a focus on how populations are impacted, these visualizations are are easily searchable, and students can choose to view prevailing or worst-case conditions at each site. Clear methodology documents are linked, and all data is well-sourced. This resource is recommended for teaching.
Teaching Tips
Standards
Resource Type and Format
Scientist Reviewed
This resource has been reviewed by SubjectToClimate's climate scientists and verified for scientific accuracy and up-to-date information. Our review process ensures that every resource in our library reflects the current state of climate science.
Learn about our review process →