
"Habitat Degradation: Arctic Melt"

This resource has been reviewed by SubjectToClimate's climate scientists and verified for scientific accuracy and up-to-date information. Learn about our review process →
Provided by: Jill Pelto Gallery|Published on: April 27, 2021
ArtworkScientist Reviewed
6789101112
Scientist Reviewed This resource has been reviewed by SubjectToClimate's climate scientists and verified for scientific accuracy and up-to-date information. Learn about our review process →
Synopsis
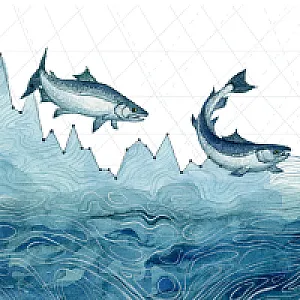
- This watercolor painting by scientist and artist Jill Pelto uses Arctic sea ice data to illustrate the effects of its critical decline.
- This painting helps students understand how arctic foxes are struggling to cope with habitat degradation due to the rapid warming in the Arctic.
-360.webp)
Subjects: Biology, Visual and Performing Arts
Authors: Jill Pelto Gallery
Region: Polar Regions, Global
Languages: English
Teaching Materials
Positives
- The resource transforms scientific data into meaningful artwork that students can explore.
- This painting connects to various important concepts: animal migration, extinction, animal adaptation, group behavior, biodiversity loss, and Arctic ecosystem decline.
Additional Prerequisites
- Students should be familiar with line graphs.
Differentiation
- In science and math classes, students could analyze and interpret the scientific data shown in this picture.
- This image could be used as an exit ticket. The teacher could show it on the screen and ask students what emotions the watercolor evokes in them after learning about a relevant topic.
- Art classes could use this as an example of line art or graphic symbolism.
- Students can learn more about the challenges that wild animals face by exploring this TEDx video, this online art exhibition, and this article.
This resource displays the influence of extreme temperatures on the Arctic Sea, creating changes in the species' habitat and making response difficult. Although data needs to be updated, this resource is recommended for teaching.
Teaching Tips
Standards
Resource Type and Format
About the Partner Provider
Jill Pelto
Jill Pelto is an artist and scientist whose work focuses on communicating human-environment connections. She incorporates scientific research and data directly into her watercolor paintings — from local trends to global changes. Jill’s artwork was featured on the cover of TIME Magazine in July 2020 and has inspired online features in Smithsonian and PBS News Hour. Jill has created a science-art activity based on this idea and has worked with K-12 students across the U.S. and beyond. By pairing graphical information with visual imagery, Jill hopes students can learn about and connect to climate change topics (good, bad, and in-between) in ways that educate and are emotionally relevant. This data-art activity is flexible and allows students to make their own graph art to share topics they care about.
Scientist Reviewed
This resource has been reviewed by SubjectToClimate's climate scientists and verified for scientific accuracy and up-to-date information. Our review process ensures that every resource in our library reflects the current state of climate science.
Learn about our review process →