
IR Window for Greenhouse Gases

This resource has been reviewed by SubjectToClimate's climate scientists and verified for scientific accuracy and up-to-date information. Learn about our review process →
Provided by: King's Centre for Visualization in Science|Published on: April 27, 2021
Data, Graphs, and MapsScientist Reviewed
9101112
Scientist Reviewed This resource has been reviewed by SubjectToClimate's climate scientists and verified for scientific accuracy and up-to-date information. Learn about our review process →
Synopsis
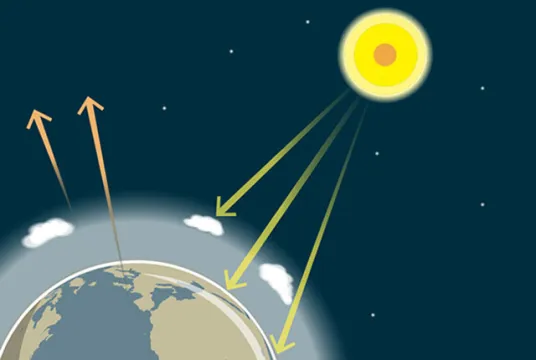
- In this activity, students can use an interactive graph to examine the infrared (IR) spectrum of specific greenhouse gases.
- Students can see how much IR radiation certain greenhouse gases absorb in our atmosphere based on their current concentrations.
Subjects: Chemistry, Earth and Space Sciences
Authors:
Region: Global
Languages: English
Teaching Materials
Positives
- Students are able to explore four different graphs and eight different greenhouse gases.
- Students are able to differentiate how much IR radiation certain greenhouse gases are actually absorbing in our atmosphere.
Additional Prerequisites
- Students must have their devices and an Internet connection to be able to access this activity.
- Students must be familiar with the greenhouse gases, the greenhouse effect, IR absorption, and global warming potential (GWP).
- Students and teachers can use the "Help" and "Display Options" menus at the top for additional information.
Differentiation
- Students could discuss and analyze the table that includes the atmospheric residence time and GWP for the greenhouse gases to discuss how those values affect the ability of different gases to increase global warming.
- Chemistry or physics teachers could invite students to interpret the graph's curve that is presented in the Black Body Curve option.
- Other resources related to this topic include a lesson plan about Heating It Up: The Chemistry of the Greenhouse Effect and Greenhouse Gases: A Closer Look.
This resource is recommended for teaching.
Teaching Tips
Standards
Resource Type and Format
About the Partner Provider

King's Centre for Visualization in Science
The King's Centre for Visualization in Science is a research center committed to improving the global public understanding of science through research and the creation and dissemination of peer-reviewed interactive electronic learning tools to see and understand science.
Scientist Reviewed
This resource has been reviewed by SubjectToClimate's climate scientists and verified for scientific accuracy and up-to-date information. Our review process ensures that every resource in our library reflects the current state of climate science.
Learn about our review process →