
Youth Climate Story: Pine Beetles and Wildfires in Colorado

This resource has been reviewed by SubjectToClimate's climate scientists and verified for scientific accuracy and up-to-date information. Learn about our review process →
Provided by: ACE|Published on: April 27, 2021
VideosScientist Reviewed
6789101112
Scientist Reviewed This resource has been reviewed by SubjectToClimate's climate scientists and verified for scientific accuracy and up-to-date information. Learn about our review process →
Synopsis
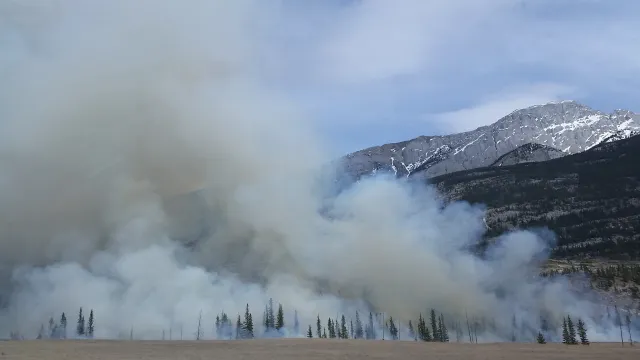
- This short video shows the sadness of home loss and wildfire devastation in Colorado from a youth's perspective.
- In the video, Xiuhtezcatl describes how trees dying due to pine beetle infestations are fueling wildfires near his home in Boulder, CO.
- The "Analyzing the Rise in United States Wildfires" lesson plan is included with this resource.
Subjects: Social Studies, Biology, Earth and Space Sciences, Mathematics
Authors: ACE
Region: North America, USA - West, United States, Colorado
Languages: English
Teaching Materials
Positives
- This video contains powerful images to relate the emotional toll of losing a home due to a wildfire.
- The following lesson plan supports students in visualizing wildfire data on a graph.
Additional Prerequisites
- Students should be familiar with creating line graphs and the dependent vs. independent variables.
- To access the lesson plan after the video, teachers will need to sign up for a free account and log in.
Differentiation
- English classes could use this lesson, as students read about climate change and write about the connection between climate change, wildfire frequency, and temperature trends.
- Teachers may want to spend a few moments linking the rise in pine beetle populations to changes in weather patterns linked to climate change.
- If students don't live in an area affected by wildfires, discuss other ways ecological imbalances have impacts to humans (e.g., invasive species out-competing local wildlife that may have economic value or the loss of riparian habitat leading to more severe flooding events).
- Teachers may need to support students in graphing with a double y-axis. If this is too challenging, students could graph the wildfire data on a separate graph, rather than the provided graph on the worksheet.
More information about the ecology of pine beetles and the relationship to climate change can be found on the USDA Forest Service website.
Teaching Tips
Standards
Resource Type and Format
About the Partner Provider

Action for the Climate Emergency (ACE)
Action for the Climate Emergency (ACE)'s mission is to educate, inspire and support young people to lead the fight for their future. To achieve their mission, ACE ensures young people have everything they need to understand the science of climate emergency and advocate for solutions.
Scientist Reviewed
This resource has been reviewed by SubjectToClimate's climate scientists and verified for scientific accuracy and up-to-date information. Our review process ensures that every resource in our library reflects the current state of climate science.
Learn about our review process →