
Environmental Change Model

This resource has been reviewed by SubjectToClimate's climate scientists and verified for scientific accuracy and up-to-date information. Learn about our review process →
Provided by: Climate Reanalyzer|Published on: August 11, 2023
Articles/WebsitesScientist Reviewed
9101112AP
Scientist Reviewed This resource has been reviewed by SubjectToClimate's climate scientists and verified for scientific accuracy and up-to-date information. Learn about our review process →
Synopsis
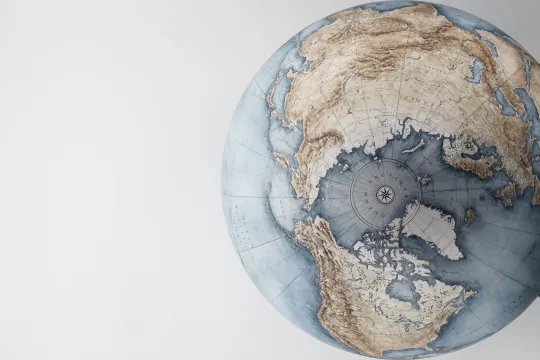
- This interactive climate map combines NCAR and NASA climate models to provide detailed information about historic and future shifts in global and regional temperature, ice mass, biomes, and precipitation.
- Students can select their region of interest, environmental condition, and time frame to view on the map, with a detailed description of the information provided below.
Subjects: Earth and Space Sciences, Computer Science
Authors: Climate Reanalyzer, University of Maine and the Climate Change Institute
Region: North America, USA - Northeast, United States, Global, Maine
Languages: English
Teaching Materials
Positives
- This model is easy to use and provides excellent instructions.
- The colorful maps allow students to visually see how global warming will affect ecosystems and people all over the world.
Additional Prerequisites
- The map for the U.S. Northeast provides the best image of Maine for students in that location.
- If you have a slower Internet connection, press the stop button above the map and click through the temperatures slowly.
- The IPCC RCP-8.5 is referring to an emissions scenario and the delta symbol means "change in" for the temperature scale at the top.
Differentiation
- Younger students may need to know what types of plants and animals are present in the different biomes.
- Advanced placement or college level students could read the linked scientific journal article about the sensitivity of the model to glacial forcings.
- Biology students could use this tool to estimate the effects of climate change on native plants in their local area and present their findings to the class.
- Social studies or economics students could use this tool to estimate the economic risks associated with letting climate change go unchecked for farmers, businesses, and our global economy.
This resource enables students to explore climate variables across the globe in response to different climate change scenarios and even past climate conditions. The methods used to evaluate the data are described and more information is directly linked. While the future climate scenarios are from the older RCPs from the 2014 IPCC report (not the more updated SSP scenarios from 2021), this resource is still highly recommended for teaching.
Teaching Tips
Standards
Resource Type and Format
Scientist Reviewed
This resource has been reviewed by SubjectToClimate's climate scientists and verified for scientific accuracy and up-to-date information. Our review process ensures that every resource in our library reflects the current state of climate science.
Learn about our review process →